How Homeowners Find, Compare & Choose Roofers: The Full 2026 Survey
Homeowners make several decisions before they ever contact a roofer. Our roofing industry trust report 2026 examines what gets their attention, what homeowners look for in a roofer and how they research and compare contractors, what builds or breaks trust, which factors influence hiring decisions, and how websites, reviews, contact preferences, and AI are shaping the search.
Our Methodology
RoofingROI Labs surveyed 250 U.S. respondents through Pollfish on July 31, 2026. Every participant passed a screening question confirming they’d hired a roofing contractor within the previous three years, and all 250 completed the questionnaire. Of the respondents, 228 owned their homes (91.2%) and 22 rented (8.8%). Results use the full sample unless noted otherwise. Multiple-selection questions allowed more than one answer, so percentages can exceed 100%. These findings provide roofing industry statistics from the consumer perspective for the US roofing market in 2026 without measuring total market size or year-over-year growth.
Key findings
72%
Selected bad reviews as a reason not to contact a roofer
79.2%
Chose 4.8 stars with 300 reviews over 5.0 stars with 20 reviews
94.8%
Said seeing a completed project nearby increases trust
- 80% contacted at least two roofing companies before deciding.
- 46.8% check reviews or ratings first when researching on a phone.
- 68% prefer a phone call as their first contact with a roofer.
- 62% rank reputation as the single most important selection factor.
- 94.4% were happy with their roofer, while only 49.6% left a Google review.
- 56.8% would be very or somewhat likely to start a new roofer search with AI.
Who we surveyed and why they hired a roofer
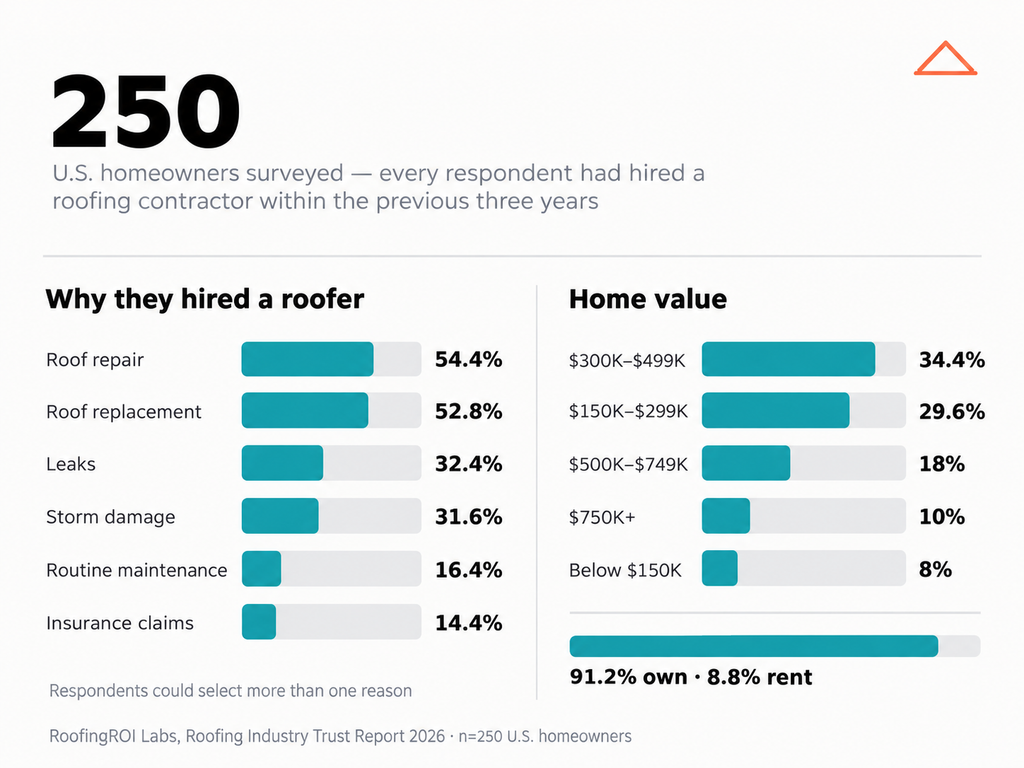
All 250 respondents had hired a contractor within the previous three years. Their reasons for hiring varied, giving the homeowner roofing survey 2026 a mix of repair, replacement, and other project needs.
- Why they hired: Roof repair led at 54.4%, followed by roof replacement at 52.8%, leaks at 32.4%, storm damage at 31.6%, routine maintenance at 16.4%, and insurance claims at 14.4%. Respondents could select more than one answer.
- Property values: 34.4% reported values between $300,000 and $499,000, 29.6% between $150,000 and $299,000, 18% between $500,000 and $749,000, 10% at $750,000 or more, and 8% below $150,000. Overall, 91.2% owned their homes and 8.8% rented.
This background provides useful context for the roofer search data 2026 that follows, from how respondents found contractors to what ultimately influenced their choice.
How homeowners find roofing contractors
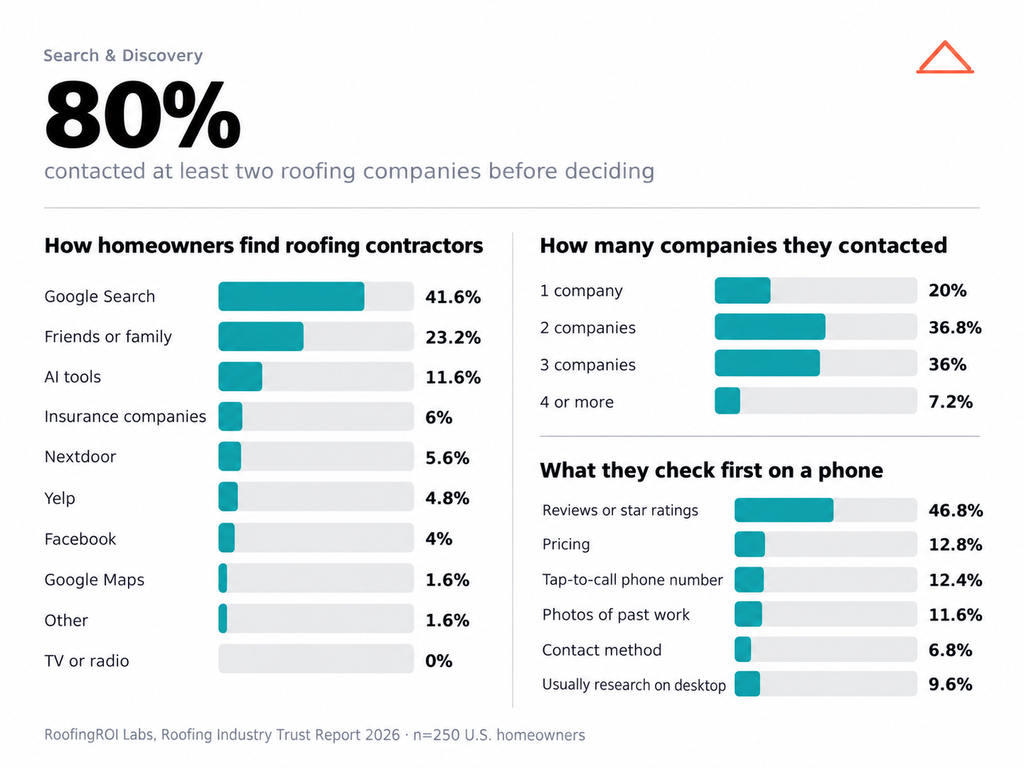
Google Search remains the most common first stop at 41.6%, followed by recommendations from friends or family at 23.2%. AI tools such as ChatGPT, Perplexity, Claude, and Gemini already account for 11.6% of first searches. Insurance companies reached 6%, Nextdoor 5.6%, Yelp 4.8%, Facebook 4%, Google Maps 1.6%, and other sources 1.6%. Nobody selected TV or radio. The roofer search data from 2026 show that homeowners are finding contractors through a mix of search engines, personal referrals, local platforms, and AI tools.
Most homeowners compare more than one roofing company
Only 20% contacted a single roofer. Another 36.8% contacted two companies, 36% contacted three, and 7.2% contacted four or more. Combined, 80% contacted at least two roofing contractors before deciding. Residential roofer search data from 2026 show that getting found is usually only the first step. Most homeowners still compare several businesses before deciding who gets the work.
How homeowners research roofers on their phones
When respondents researched a roofer on their phone, 46.8% checked reviews or star ratings first. Pricing followed at 12.8%, a tap-to-call phone number at 12.4%, and photos of past work at 11.6%. Another 6.8% looked for a contact method first, while 9.6% said they usually do this research on a desktop. The question doesn’t tell us how much total roofing research happens on mobile, but it does show which trust signals deserve the most visibility on a smaller screen.
What homeowners check before hiring a roofer
The pre-call research goes well beyond finding a phone number. Reviews, company information, project evidence, and proof of legitimacy all influence whether a business makes it onto a homeowner’s shortlist.
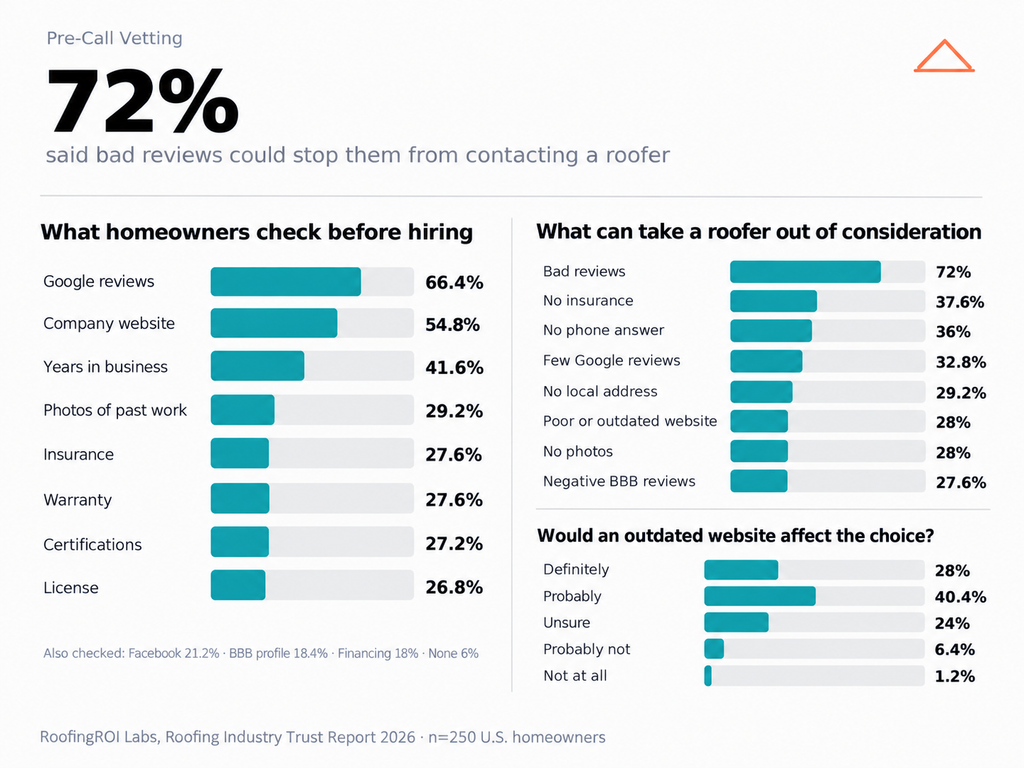
- Google reviews – 66.4%
- Company website – 54.8%
- Years in business – 41.6%
- Photos of past work – 29.2%
- Insurance – 27.6%
- Warranty – 27.6%
- Certifications – 27.2%
- License – 26.8%
Social proof isn’t the only pre-call check
Facebook was checked by 21.2% of respondents before calling, while 18.4% looked at the company’s BBB profile and 18% checked financing availability. Only 6% said they checked none of the listed information. The results show that homeowners don’t rely on one universal checklist. Some focus heavily on reviews, while others want proof of insurance, experience, warranty coverage, or financial options before they’re comfortable making contact. The more of that information a roofing company makes easy to verify, the fewer unanswered questions a prospect carries into the first conversation.
What can take a roofer out of consideration?
Negative signals can narrow a homeowner’s shortlist before the contractor ever knows the prospect was looking. Bad reviews are by far the strongest disqualifier in the survey.
- Bad reviews – 72%
- No insurance – 37.6%
- No phone answer – 36%
- Few Google reviews – 32.8%
- No local address – 29.2%
- Poor or outdated website – 28%
- No photos – 28%
- Negative BBB reviews – 27.6%
The remaining disqualifiers point to a similar problem: missing or hard-to-find information can create doubt before a prospect ever reaches out. 26.4% said having no website could stop them from contacting a roofer, while 24.8% selected hard-to-find pricing. The survey doesn’t show whether either issue would rule out a contractor every time, but it does show that basic company information needs to be easy to find and verify.
An outdated website can affect the hiring decision
Website quality isn’t simply a design preference. 28% said an outdated roofing website would definitely affect their choice, while another 40.4% said it probably would. Combined, 68.4% gave a definite or probable yes. Another 24% were unsure, 6.4% said probably not, and 1.2% said not at all. Since more than half of respondents also check the website before calling, the site has a direct role in roofing consumer behavior long before a form is submitted or a salesperson gets involved.
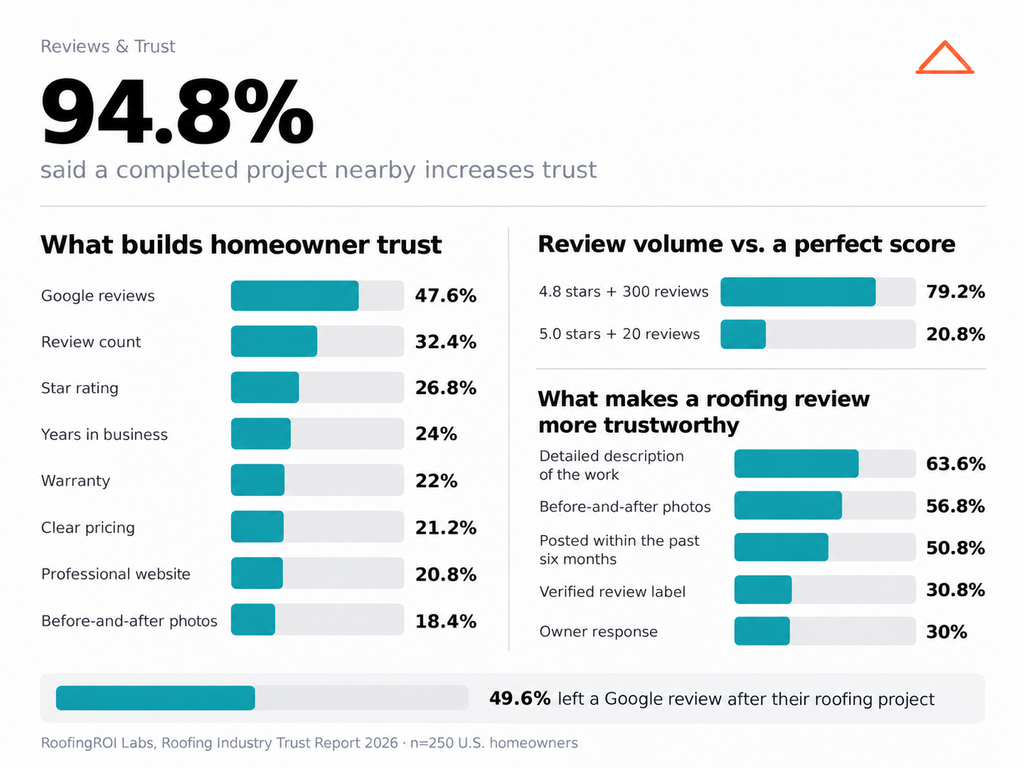
What builds homeowner trust in roofing contractors?
When respondents could choose up to three factors that made them trust a roofing company most, Google reviews led at 47.6%. Review count followed at 32.4%, star rating at 26.8%, years in business at 24%, warranty at 22%, clear pricing at 21.2%, and a professional website at 20.8%. Before-and-after photos reached 18.4%, BBB accreditation 16%, a local office 12.4%, family ownership 10.4%, manufacturer certifications 8%, video testimonials 5.6%, financing 2%, and fast response 1.6%.
Review volume matters more than a perfect score
The clearest test of review volume came when respondents had to choose between two companies. 79.2% picked a roofer with 4.8 stars and 300 reviews, while only 20.8% chose a perfect 5.0 rating supported by 20 reviews. That doesn’t mean a 5.0 rating hurts a company. It shows that homeowners appear to consider how much evidence sits behind the score. A very strong rating backed by substantial review volume can look more convincing than perfection based on a much smaller sample.
What review thresholds do homeowners expect?
The most common minimum number of reviews was 25+ at 26%, followed by 50+ at 23.2% and 100+ at 16.4%. Another 14% were comfortable with 10+, while 5.6% wanted 200+ reviews. For 14.8%, review count didn’t matter. These findings don’t produce one magic target for every contractor, but they do show that review quantity plays a role for most respondents. The threshold varies, so steady review growth is more useful than treating one specific count as the point where reputation work is finished.
A 4.5-star rating is the most common minimum
When asked for the minimum star rating they’d accept, 33.2% chose 4.5 stars, making it the most common response. Another 22.4% chose 4.0, 11.6% wanted at least 4.8, 11.2% selected 4.7, 10.8% chose 4.3, and 2.8% were comfortable with 3.5. Rating didn’t matter to 8%. Read alongside the review-count results, the data shows that homeowners don’t judge reputation from a single number. They weigh the rating against the amount and quality of feedback supporting it.
What makes a roofing review more trustworthy?
Respondents valued specific, recent evidence when judging individual Google reviews. They could select up to three qualities.
- Detailed description of the work – 63.6%
- Before-and-after photos – 56.8%
- Posted within the past six months – 50.8%
- Verified review label – 30.8%
- Owner response – 30%
- Specific employee named – 18.4%
- High word count – 12%
- Neighborhood or city mentioned – 9.2%
Nearby roofing projects create powerful local proof
A separate question produced one of the strongest results in the entire survey. 94.8% said seeing a roofing project completed in their own neighborhood increases their trust in the company, while only 5.2% said it doesn’t. That response gives local project evidence a different role from simply mentioning a city name. Customers can connect the contractor with real work, recognizable homes, and nearby conditions. Project galleries, reviews, and service-area content become more useful when they show where the company has actually completed work.
Good work doesn’t automatically turn into reviews
Only 49.6% selected that they left a Google review after their roofing project. 18.4% selected that they’d had a good experience but simply weren’t regular review-leavers, while 16.4% selected that nobody asked them to leave one. Other selections included forgetting at 8%, not being sure how at 5.6%, not feeling strongly either way at 5.2%, and having a bad experience but wanting to avoid confrontation at 2.4%. Because respondents could select more than one answer, these categories can overlap. Those findings show the value of a consistent follow-up process for driving repeat business and generating more reviews.
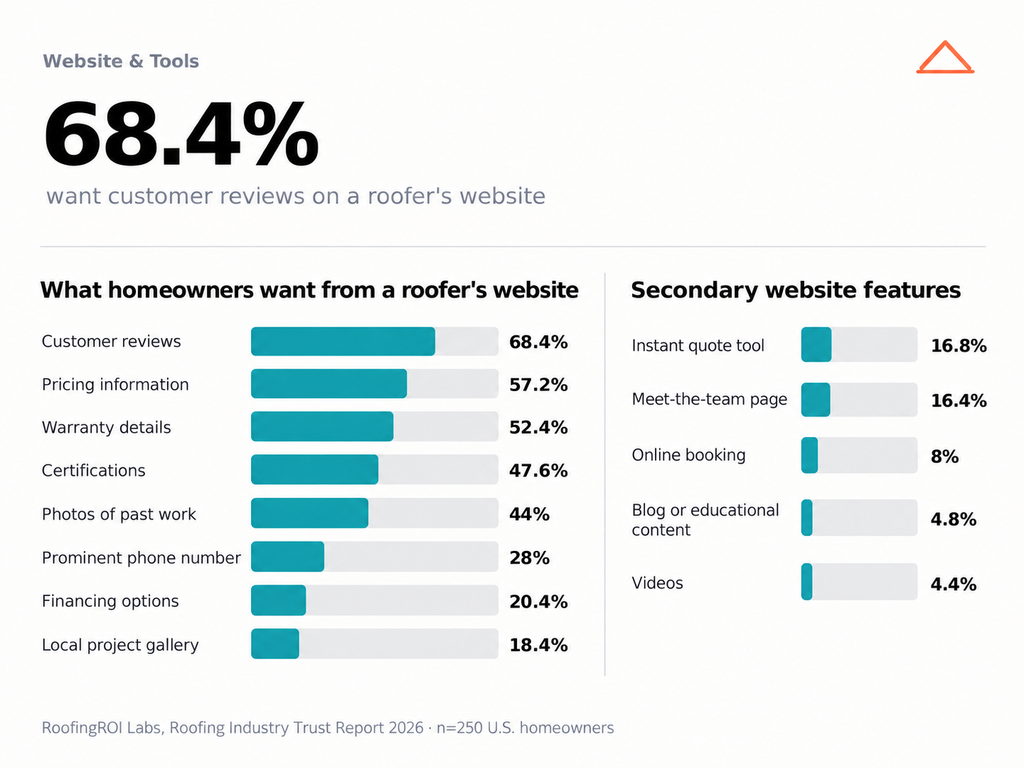
What homeowners want from a roofer’s website
When respondents could choose up to five website elements, practical information and proof dominated the top of the ranking. These roofing customer preferences show which website elements rise to the top when homeowners have to prioritize.
- Customer reviews – 68.4%
- Pricing information – 57.2%
- Warranty details – 52.4%
- Certifications – 47.6%
- Photos of past work – 44%
- Prominent phone number – 28%
- Financing options – 20.4%
- Local project gallery – 18.4%
Secondary website features still have a role
An instant quote tool was selected by 16.8%, followed closely by a meet-the-team page at 16.4%. Online booking reached 8%, a blog or educational content 4.8%, and videos 4.4%. Since respondents could select only five elements, lower placement doesn’t mean those features have no value. It shows what homeowners prioritize when forced to choose. For companies investing in web design & development, the strongest hierarchy is clear: reputation, pricing context, warranties, credentials, completed work, and an easy path to contact deserve the most prominent space.
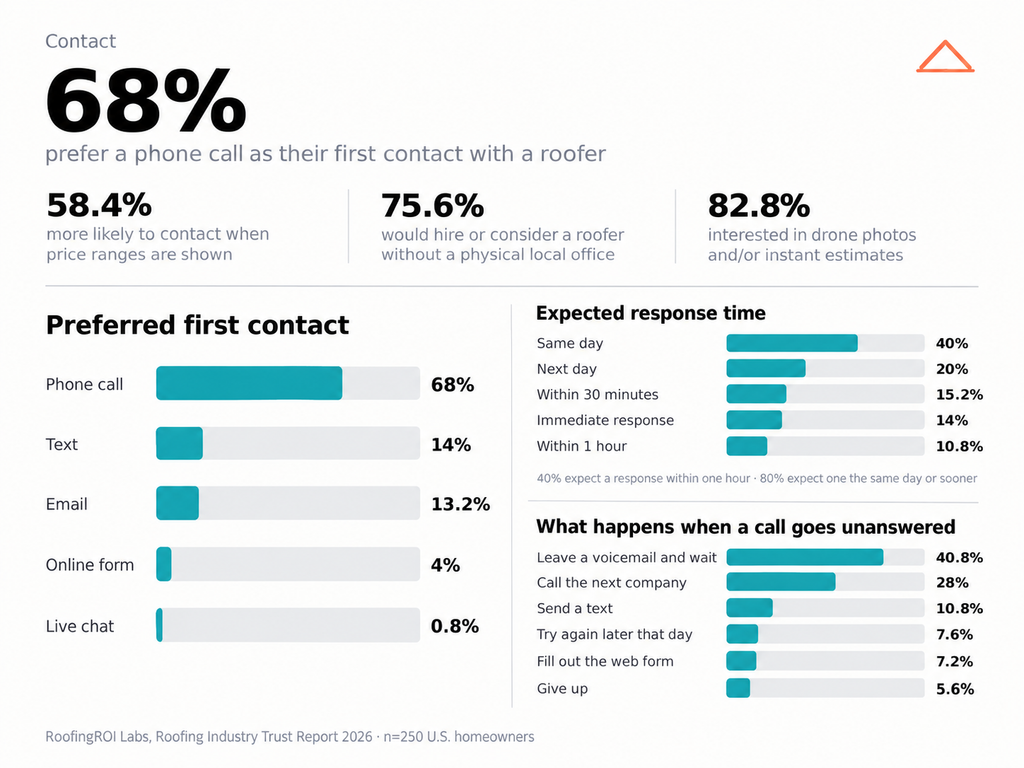
Price ranges can increase the likelihood of contact
58.4% said seeing price ranges would make them more likely to contact a roofing company because the information saves time and builds trust. Another 27.6% said roofing is too customized and they’d expect to request a quote anyway, while 14% said it depends on how pricing is presented. That finding is important because the lowest price later ranks near the bottom of the final-decision question. Homeowners can want pricing transparency without automatically looking for the cheapest contractor, which gives companies room to explain value alongside cost.
A physical local office isn’t essential
When asked whether they’d hire a roofing company without a physical local office, 40% said yes, 35.6% said it depends, and 24.4% said no. That means 75.6% were either willing to hire or at least open to considering a company without one. Combined with the 94.8% response to completed neighborhood projects, the findings suggest that local credibility can come from several sources. Strong local SEO services can support that proof through accurate service areas, consistent company information, local reviews, and completed projects tied to the communities a roofer actually serves.
Drone photos & instant estimates attract strong interest
We also asked whether drone inspection photos or an instant online estimate tool would make respondents more likely to contact a roofing company. 73.6% selected both tools, while another 3.6% selected drone photos only and 5.6% selected an instant estimate only. Just 17.2% selected neither. Combined, 82.8% expressed interest in at least one of the two tools. That’s a strong stated preference, but it isn’t a measured conversion increase, so contractors still need to judge these features by the quality of inquiries, booked inspections, and sales they actually produce.
Phone remains the preferred first contact
Phone remains the dominant first-contact preference at 68%. Text comes next at 14%, followed by email at 13.2%, an online form at 4%, and live chat at just 0.8%. The result gives contractors a clear primary channel without eliminating the need for alternatives. Nearly one-third of respondents still prefer something other than calling, so understanding how homeowners want to contact roofing companies can help decide which secondary options belong beside the phone number without making the contact experience unnecessarily complicated.
Most homeowners expect a response the same day
The largest group, 40%, expects a response sometime the same day. Another 20% accepts a reply the next day, while 14% wants an immediate response, 15.2% expects one within 30 minutes, and 10.8% expects one within an hour. Combined, 40% expect a response within one hour and 80% expect one the same day or sooner. That creates a useful service benchmark without suggesting that every roofing lead expects someone to answer within seconds.
How unanswered calls can benefit your competitors
When a roofing company didn’t answer, 40.8% left a voicemail and waited, but 28% immediately called the next company. Another 10.8% sent a text, 7.6% tried again later that day, 7.2% filled out the company’s web form, and 5.6% gave up entirely. The result helps explain why response handling matters even though only 1.6% selected fast response as a top trust factor. Customers may not view answering the phone as exceptional, but some respond quickly when that basic expectation isn’t met.
Contact forms lose leads for more than one reason
We also asked whether respondents had ever started a contact form and stopped before submitting it. 32.8% said they’d never abandoned one. Among the reasons selected across the full sample, finding a better option led at 24.8%, followed by a site that felt sketchy at 22.8%, lack of trust at 22.4%, too much personal information at 20.8%, preferring to call at 18.4%, and the form being too long at 18%. These responses shouldn’t be treated as a measured roofing-site abandonment rate, but they show that form design and company credibility work together.
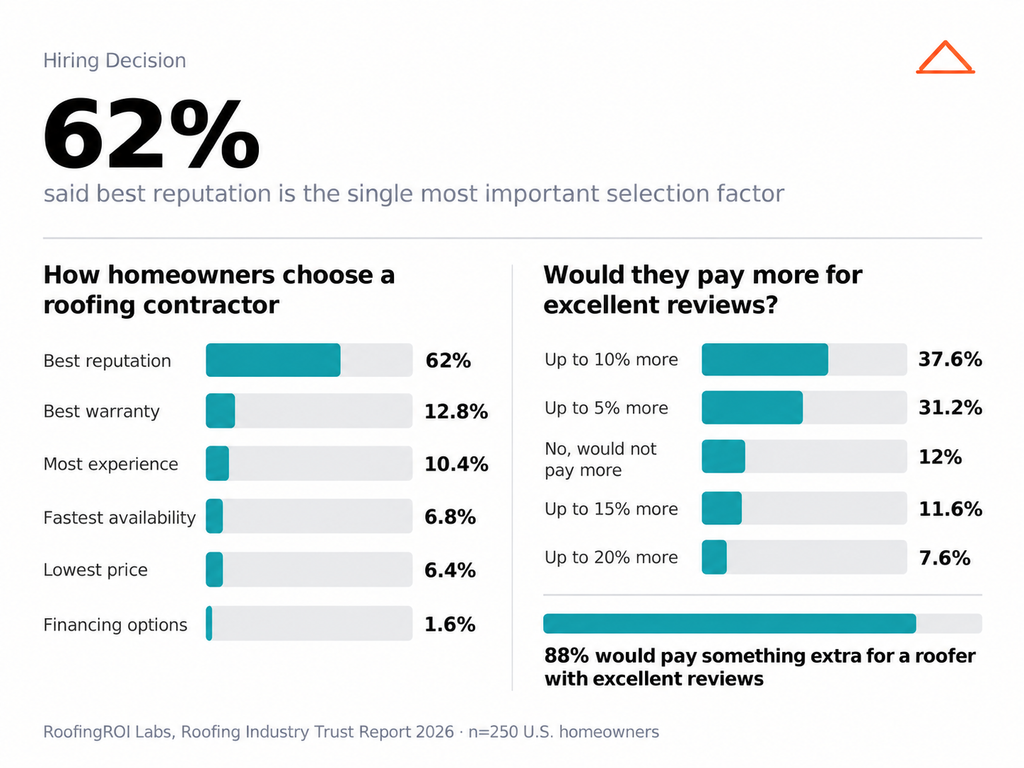
How homeowners choose a roofing contractor
When respondents had to choose the single factor that mattered most, 62% selected best reputation. Best warranty came second at 12.8%, followed by most experience at 10.4%, fastest availability at 6.8%, lowest price at 6.4%, and financing options at 1.6%. This is one of the clearest findings in the report. Of all the factors homeowners consider when hiring a roofer, reputation is the one respondents most often put ahead of everything else. That makes managing reviews and reputation a direct part of competing for the job.
What roofing reputation statistics say about paying more
Only 12% said they wouldn’t pay more for a roofer with excellent reviews. Another 31.2% would pay up to 5% more, 37.6% up to 10% more, 11.6% up to 15% more, and 7.6% up to 20% more. Combined, 88% expressed some willingness to pay more. These numbers reflect stated preferences, not what respondents ultimately paid, but they reinforce the importance of homeowner trust in roofing contractors. When that trust is backed by excellent reviews, many respondents are willing to accept a higher price instead of choosing on cost alone.
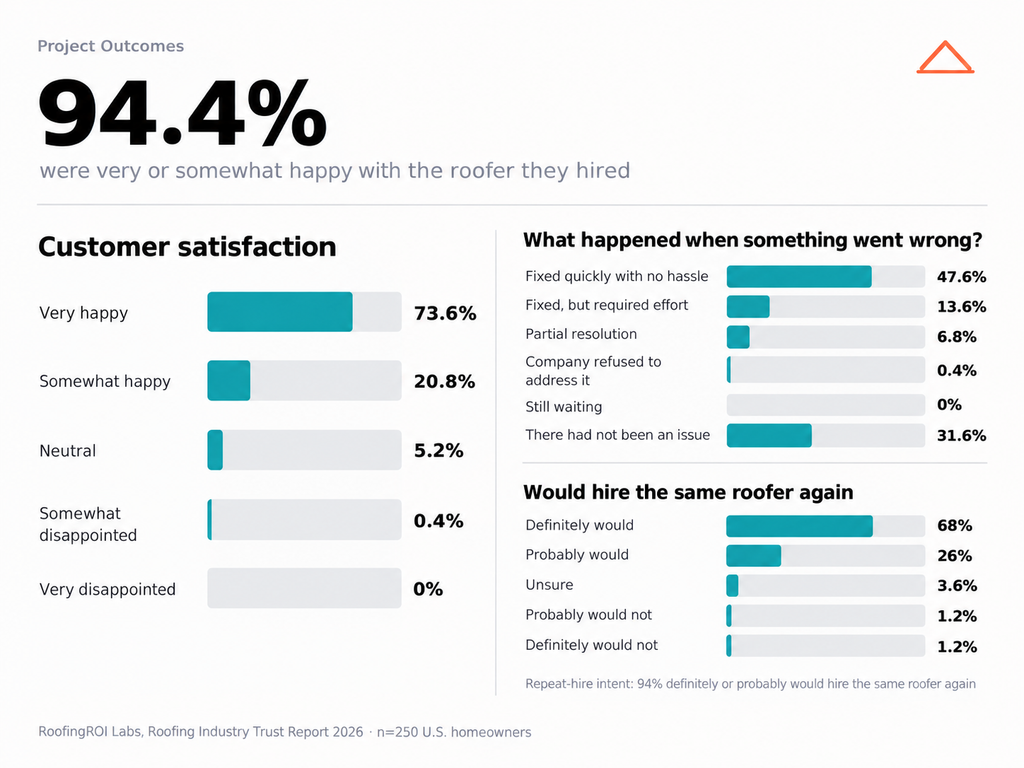
Most customers were happy with the roofer they hired
Project outcomes were overwhelmingly positive. 73.6% said they were very happy with the roofer they hired, while another 20.8% were somewhat happy, bringing the combined satisfaction rate to 94.4%. Another 5.2% were neutral, 0.4% were somewhat disappointed, and nobody very disappointed.
Among the roofing marketing statistics for 2026 in this survey, that satisfaction rate stands out against the much more competitive process homeowners go through before choosing who to hire.
What happened when something went wrong?
We also asked how roofing companies handled problems when they came up. 47.6% said the roofer fixed the issue quickly with no hassle, while 13.6% said it was fixed but required effort from them. Another 6.8% received only a partial resolution, 0.4% said the company refused to address the problem, nobody was still waiting, and 31.6% said there hadn’t been an issue.
Most homeowners would hire the same roofer again
Repeat-hire intent closely mirrors the satisfaction results. 68% said they’d definitely hire the same company again, while another 26% probably would, producing a combined positive response of 94%. Another 3.6% were unsure, 1.2% probably wouldn’t, and 1.2% definitely wouldn’t.
The finding shows that the relationship doesn’t necessarily end when the project does. A large majority remain open to returning to the contractor they hired.
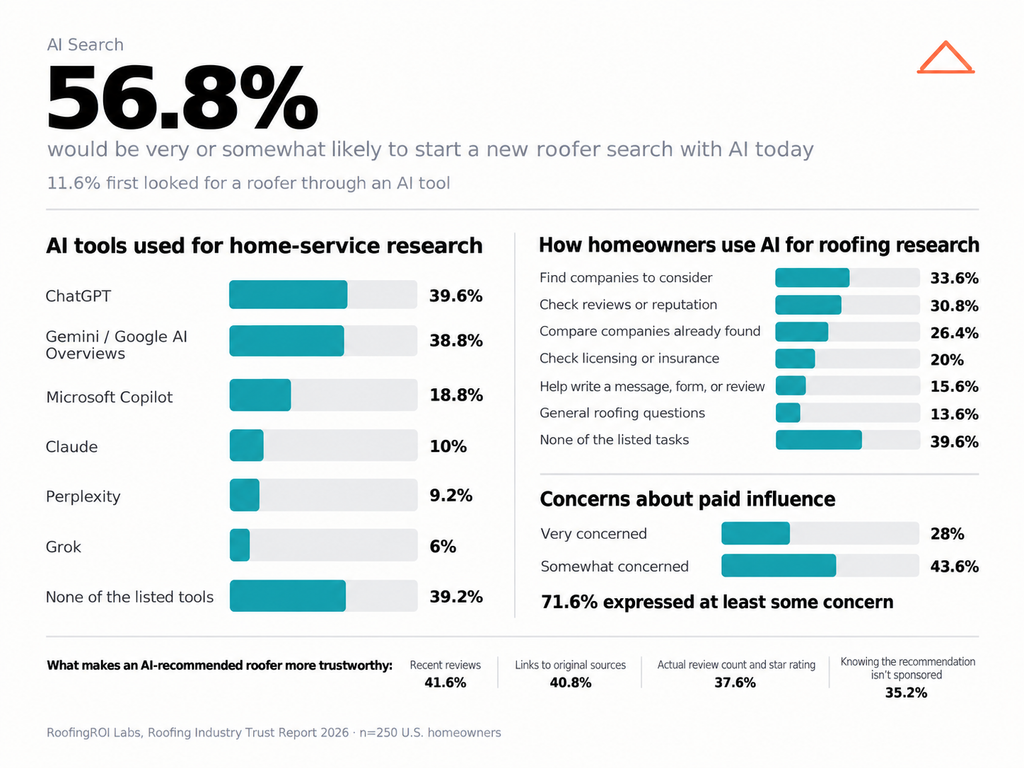
AI search for roofing contractors is already happening
AI isn’t yet the leading starting point, but it’s already measurable. 11.6% first looked for a roofer through an AI tool. Another question found that 33.6% had used ChatGPT or another AI tool to help find or evaluate a roofer, while 20.8% hadn’t yet but would consider it. If respondents needed a roofer today, 22.8% said they’d be very likely to begin with AI and another 34% somewhat likely, putting combined likely intent at 56.8%.
How homeowners are using AI for roofing research
AI shows up both in the tools respondents use and in the research tasks they give those tools. The strongest results from two of our questions show where that activity is concentrating.
- ChatGPT – 39.6%
- Gemini / Google AI Overviews – 38.8%
- Microsoft Copilot – 18.8%
- Claude – 10%
- Find companies to consider – 33.6%
- Check reviews or reputation – 30.8%
- Compare companies already found – 26.4%
- Check licensing or insurance – 20%
The results show AI appearing at several points in the research process. Homeowners are using it to discover contractors, investigate companies they’ve already found, check reputation and credentials, and answer practical questions before making contact.
AI use extends beyond the most popular tools
Perplexity was selected by 9.2% of respondents and Grok by 6%, while 39.2% selected none of the listed AI tools for home-service research. The numbers also show less common uses beyond discovery and comparison. 15.6% had used AI to help write a message, form, or review, while 13.6% had used it for general questions about roofing materials, the process, or cost. Another 39.6% said they hadn’t used AI for any of the listed roofing-search tasks. Together, the results show AI entering several points in the research process rather than one single use case.
AI recommendations don’t replace independent verification
Only 12.8% said they trusted an AI recommendation as much as one from a friend or family member. The largest group, 38.8%, trusted it about as much as a Google search result. Another 11.2% wouldn’t act without verifying the company themselves, 5.6% trusted AI less than Google, and 5.6% didn’t trust AI recommendations at all. The remaining 26% hadn’t used AI for this purpose. That puts AI recommendations closer to another research lead than to a trusted personal referral for most respondents who expressed an opinion.
Google reviews are the most common next step after an AI recommendation
After AI recommends a roofer, 35.2% said they’d check Google reviews first. Another 14% would visit the company website, 9.6% would contact the company immediately, 8% would ask AI follow-up questions, 6% would seek another opinion, and 1.6% would ignore the recommendation. Another 25.6% hadn’t used AI this way. The findings show that an AI recommendation often leads to further research. As AI becomes another entry point into the research process, AI SEO services can become one part of a broader search strategy, alongside reviews, websites, and traditional search visibility.
AI review summaries don’t fully replace the reviews
19.6% had used an AI-generated review summary and trusted it, while another 26.8% had used one but still read the original reviews afterward. Another 15.2% hadn’t used the feature but said they would, 30% preferred to read reviews themselves, and 8.4% weren’t sure how the feature worked. These results show that AI summaries can become part of the research process without fully replacing direct review reading for many respondents.
Homeowners want evidence behind AI recommendations
Paid influence is a significant concern. 28% were very concerned that AI tools might recommend companies based on paid placement or advertising instead of genuine quality, while another 43.6% were somewhat concerned. Combined, 71.6% expressed at least some concern.
When asked what would make an AI-recommended roofer more trustworthy, respondents selected:
- Recent reviews – 41.6%
- Links to original sources – 40.8%
- Actual review count and star rating – 37.6%
- Knowing the recommendation isn't sponsored – 35.2%
- Nothing would increase trust – 22%
- Visible local address or phone number – 17.2%
General AI use is already common among respondents
Most respondents already use AI regularly. 35.6% said they use AI every day, while another 30.4% use it a few times per week. Combined, 66% use AI daily or weekly. Another 11.2% use it a few times per month, 10.4% rarely use it, and 12.4% never do. That level of general familiarity provides useful context for the 56.8% who say they’d now be very or somewhat likely to start a roofer search with AI, even though a much smaller share actually began their previous roofing search there.
What AI search means for the roofing customer journey
The strongest roofing industry trends in the AI data don’t suggest that Google, referrals, websites, or reviews are disappearing. AI search for roofing contractors is becoming another way homeowners enter the research process. A homeowner can encounter a roofing company through an AI response and still verify the recommendation through Google reviews, the company website, source links, recent feedback, local details, and project evidence. For roofing companies, AI visibility and traditional trust-building are increasingly connected parts of the same customer journey.
How to cite this report:
Roofing associations, journalists, editors, marketers, and other publishers are welcome to reference findings from this report. Please credit RoofingROI Labs and identify the relevant survey question where practical.

Jordan Parkes
Owner & CEO | RoofingROI Labs
Jordan Parkes is the Owner and CEO of RoofingROI Labs, a roofing-exclusive marketing agency. With a career focused on SEO and search marketing, Jordan specializes in helping roofing companies generate leads through search, local SEO, and emerging AI search. He shares practical insights based on data and experience from hundreds of roofing campaigns.